Resources
Blog
Resource Library

July 9, 2026
LapDogs Is Back: Inside UAT-7810’s Expanding ORB Network and Its New Servers
Executive Summary: The latest Cisco Talos research shows these operators did not abandon the LapDogs ORB network after exposure. Instead, they appear to be continuing development through new tooling designed to manage, expand, and sustain compromised routers and other internet-facing devices. Cisco Talos published new research this week… Read More

June 15, 2026
The World Cup Has 48 Teams. Adversaries Are Playing Too.
During the 2020 Tokyo Olympics, held in 2021 after a pandemic-forced delay, NTT Corporation recorded approximately 450 million cyberattack attempts targeting Olympic systems. The 2022 FIFA World Cup in Qatar drew similar attention from state-aligned threat actors and opportunistic criminals. The 2026 tournament, spanning three nations, 16 cities,… Read More

May 15, 2026
Building Trust In Data: How We Added Data Quality Checks To Our Scoring Data Pipeline
Data quality is foundational to customer confidence. At SecurityScorecard, our Scoring platform processes data for thousands of companies daily. That scale requires more than strong engineering discipline. It requires clear validation patterns, consistent checks, and observable results across every critical stage of the pipeline. This post shares… Read More

May 11, 2026
The Four Questionnaires Your TPRM Team Is Managing (And Struggling to Keep Up With)
The questionnaire is the workhorse of third-party risk management. But not all questionnaires are the same and treating them like they are is one of the reasons TPRM programs fall behind. Here’s a clear-eyed look at the four types your team is juggling. 1. Initial / Intake… Read More

May 4, 2026
Amanda Smith Earns Spot on the 2026 Women of the Channel List, Showcasing SecurityScorecard’s Channel Leadership
NEW YORK– May 4, 2026— SecurityScorecard, the global leader in threat-informed third-party risk management (TPRM), today announced that CRN®, a brand of The Channel Company, has recognized Amanda Smith, Director of Public Sector Channel at SecurityScorecard, on the prestigious Women of the Channel list for 2026. Read More

April 29, 2026
SecurityScorecard Partners with Louisiana Lieutenant Governor and Department of Culture, Recreation & Tourism to Strengthen Cyber Resilience Across Key State Agencies
SecurityScorecard deploys TITAN AI to safeguard Louisiana tourism, culture, libraries, and state assets against growing supply chain risk NEW YORK– April 30, 2026—SecurityScorecard, the global leader in threat-informed third-party risk management (TPRM), today announced a partnership with Louisiana Lieutenant Governor Billy Nungesser and the Department of Culture,… Read More

April 29, 2026
What Security Teams Need to Know Now About Anthropic’s Mythos
SecurityScorecard CEO and Co-Founder Dr. Aleksandr Yampolskiy joined Yuka Royer on France 24 to discuss Anthropic’s Mythos model, noting that AI has compressed the time to respond to cyber threats, accelerated exploitation timelines, and made automation and collaboration essential for defense. For defenders, the issue is not just more… Read More

April 29, 2026
What Security Teams Need to Know Now About Anthropic’s Mythos and AI-Driven Cyber Risk
Mythos Doesn’t Change Cyber Risk. It Removes Your Time to React. Anthropic’s Mythos reinforces a reality security teams have recognized for years: cyber risk is accelerating, and the time to respond continues to shrink. The reported discovery of a 27-year-old OpenBSD vulnerability should prompt careful consideration. It does… Read More

April 21, 2026
Rethinking the Questionnaire: Why Better Tech and More People Won’t Clear Your TPRM Backlog
Assessment backlogs are a common challenge for Third-Party Risk Management (TPRM) programs. Most organizations tackle the problem by increasing their capacity through hiring or improving efficiency with technology. While both are important elements of the solution, organizations also need to implement the right process for prioritizing the necessary business… Read More
MAX

April 9, 2026
Introducing SecurityScorecard AI Agents
Transform your vendor risk management with new SecurityScorecard AI Agents. Learn how to automate security questionnaire management, gain real-time threat insights, and accelerate remediation to stay ahead of emerging cyber threats.

April 1, 2026
RSAC 2026 Recap: What Did RSAC 2026 Reveal About the Future of TPRM? SecurityScorecard’s TITAN AI Sets the Pace
CEO and Co-Founder Dr. Aleksandr Yampolskiy, CISO Steve Cobb, and SecurityScorecard leaders joined chief information security officers (CISOs), partners, and industry experts at RSAC 2026 to discuss how AI, threat intelligence, and continuous monitoring are reshaping third-party risk management (TPRM). RSAC 2026 reinforced a growing gap between how… Read More

March 31, 2026
AI Is Reshaping Cyber Risk in 2026: Why Boards Must Take Ownership Now
Cybersecurity leaders must accept a hard truth: AI has already broken the traditional model of defense in 2026. Attackers now operate faster, at lower cost, and at greater scale than most organizations can handle. The only viable response is to rethink security as a continuous, business-driven risk function. Read More
March 31, 2026
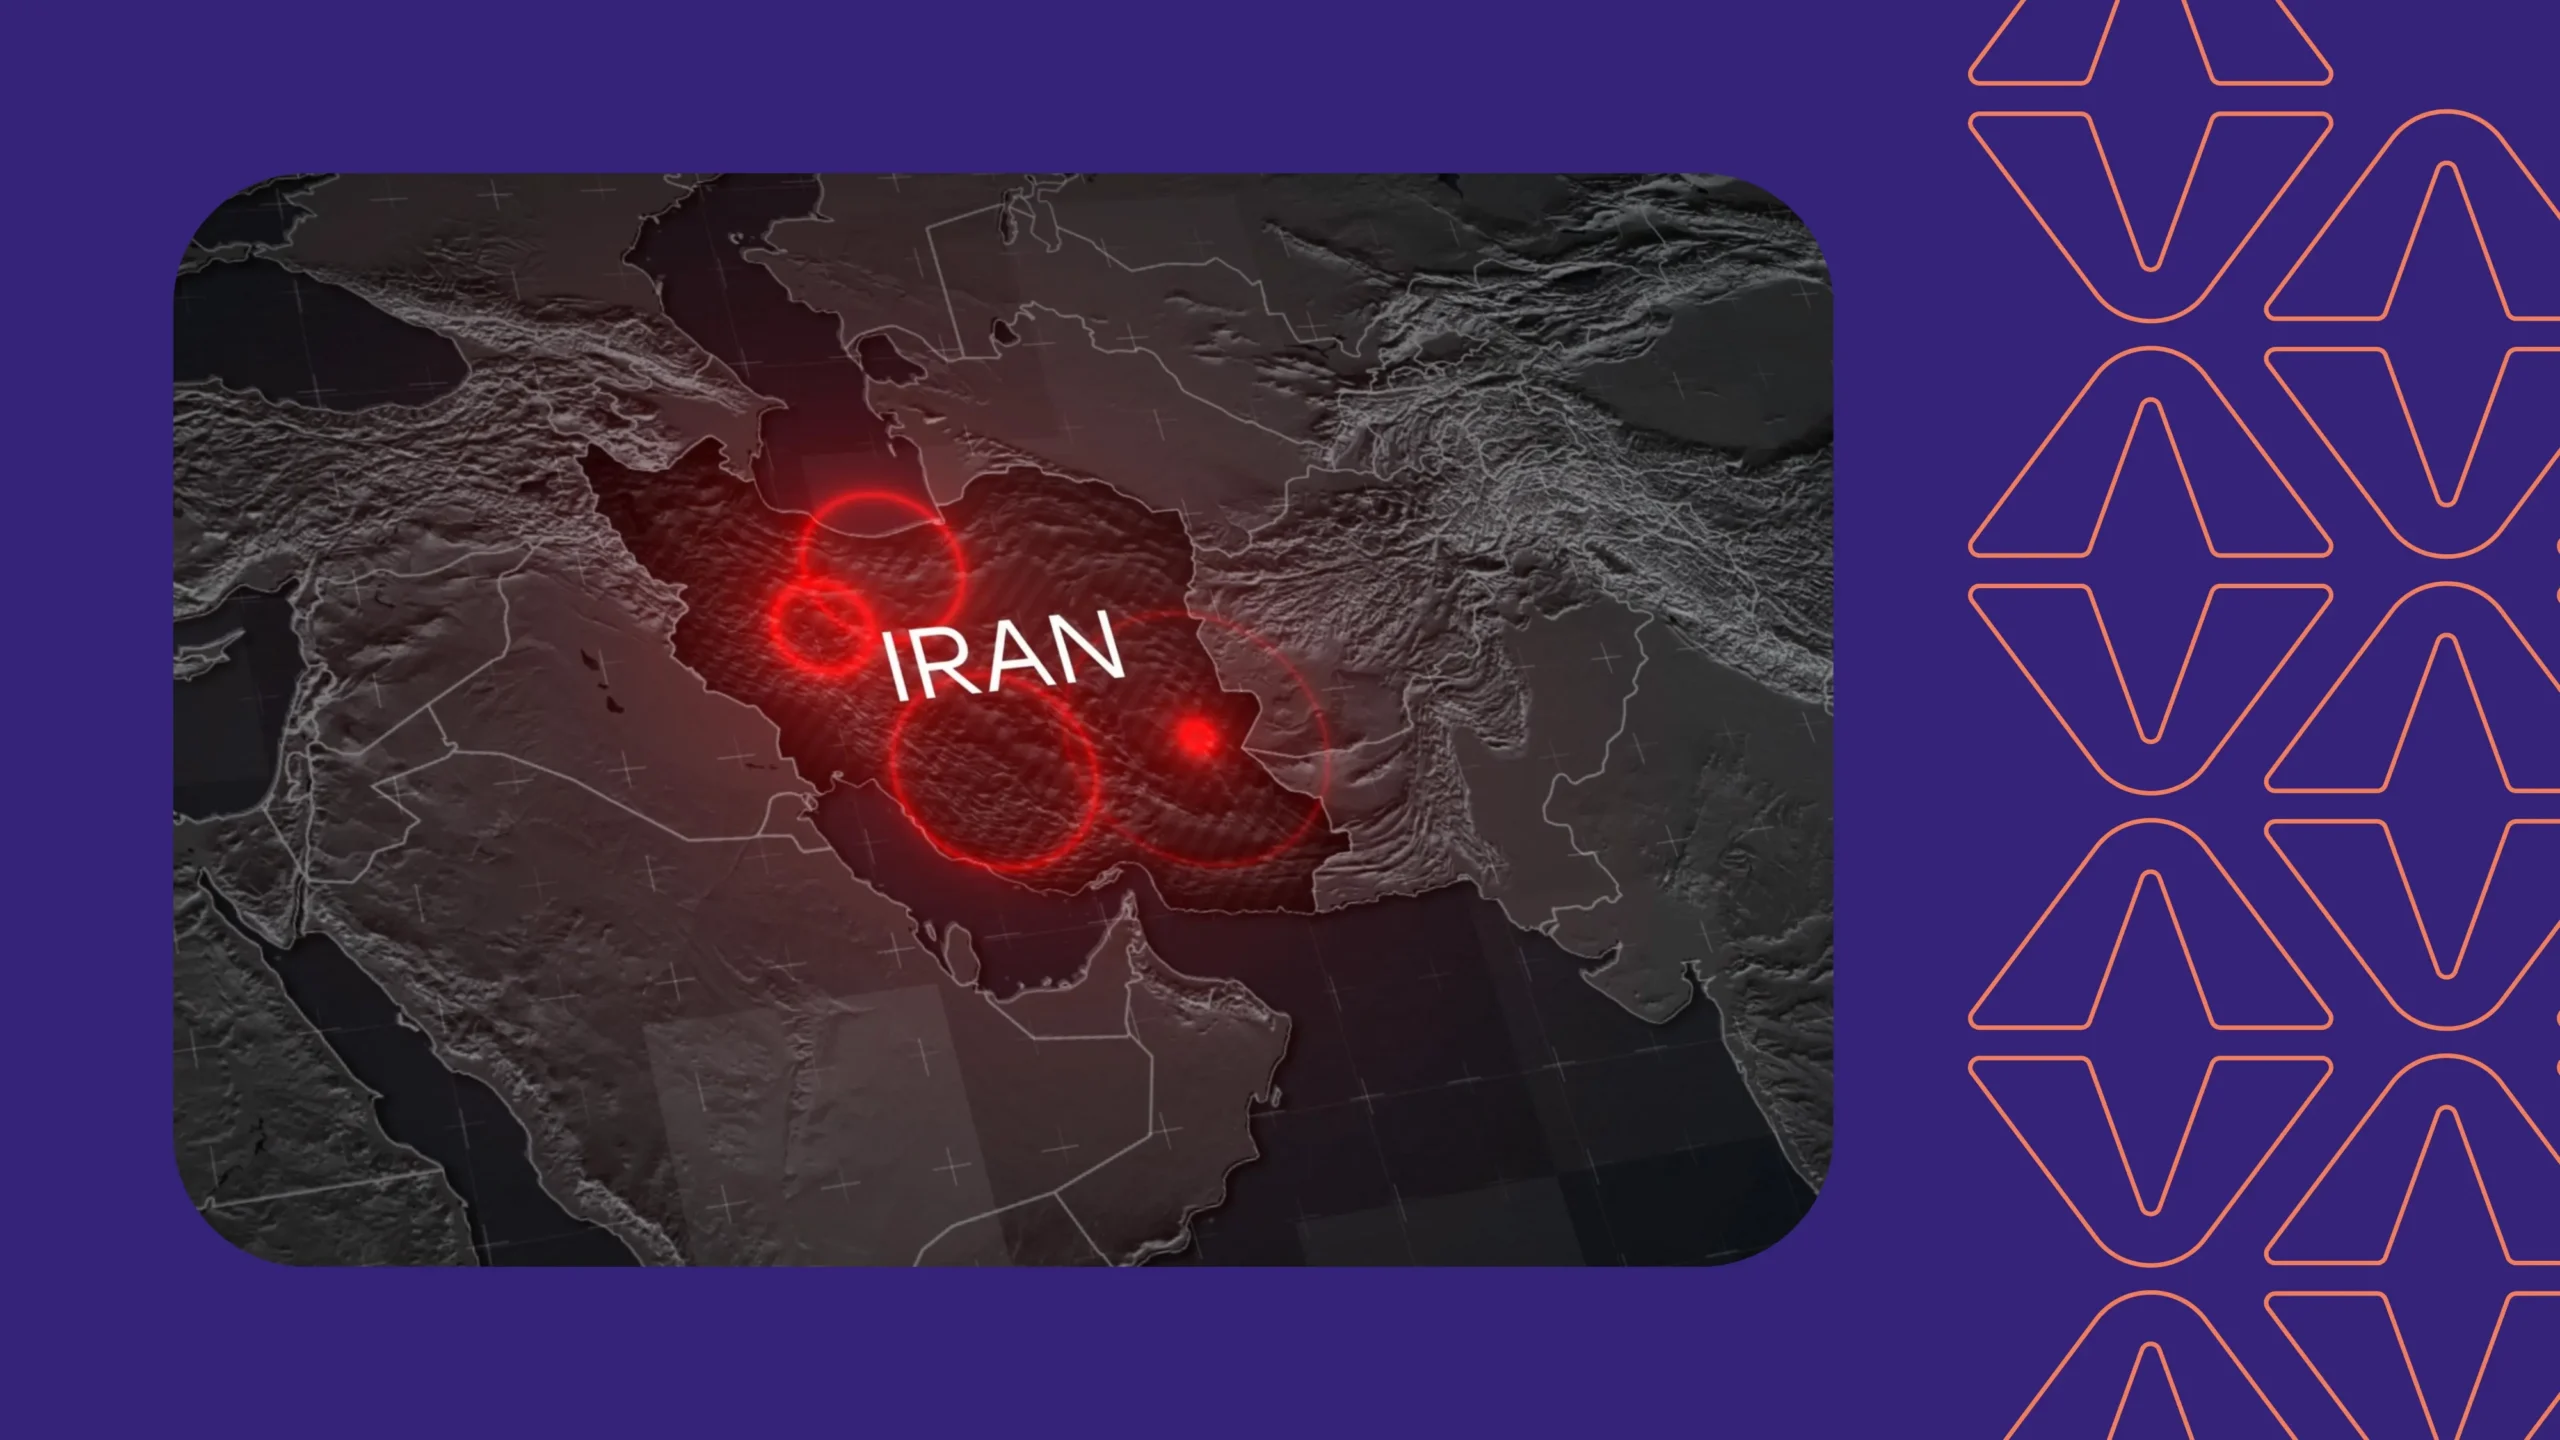
Iran Conflict and the Expanding Cyber Front: What Government Leaders Need to Know
When conflict escalates in the Middle East, the battlefield is never limited to geography. It extends into energy grids, government networks, transportation systems, and financial infrastructure. The current war involving Iran is no exception. While missiles and airstrikes dominate headlines, the parallel cyber dimension may prove equally consequential,… Read More

March 31, 2026
SecurityScorecard Appoints Dean Sysman to Board of Directors
SecurityScorecard today announced that Dean Sysman, Co-Founder and Executive Chairman of Axonius, has joined its Board of Directors as an independent director. Dean is one of the most respected builders in cybersecurity today. Sysman co-founded Axonius and scaled it into a leader in cyber asset management. The platform… Read More

March 26, 2026
RSAC 2026 Talk: Transforming Third-Party Risk Management From Compliance Checkboxes to Security Resilience
The traditional approach to managing supply chain risk is broken. For years, organizations have relied on annual questionnaires and static attestations to “check the box” for compliance. However, as SecurityScorecard CISO Steve Cobb highlighted in his RSAC 2026 talk, “The Outside-In Advantage: Modernizing TPRM with AI and Threat… Read More
March 24, 2026
SecurityScorecard and Dataminr Partner to Deliver Preemptive Cyber Defense for the Enterprise
Combining third party risk and external attack surface management with client-tailored threat intelligence to help organizations stop threats before they strike.
February 25, 2026
What the Mississippi Ransomware Attack Means for Healthcare and How to Protect Critical Infrastructure
A ransomware attack shut down clinics across Mississippi. Learn how healthcare and critical infrastructure can prevent supply chain-driven cyber disruptions.
February 17, 2026
What Are the Real Security Risks of Agentic AI and OpenClaw?
SecurityScorecard’s STRIKE Threat Intelligence team examines exposed OpenClaw deployments and the broader security risks of agentic AI, including remote code execution vulnerabilities, prompt injection, and the security controls organizations must implement now.

February 14, 2026
What is a CVE and Why is It Important?
What is a CVE? This guide explains how security teams use Common Vulnerabilities and Exposures to identify, track, and prioritize the threats that matter most.
February 11, 2026
How Exposed OpenClaw Deployments Turn Agentic AI Into an Attack Surface
SecurityScorecard’s STRIKE Threat Intelligence team details new research on exposed OpenClaw agentic AI deployments, explaining how attackers can abuse them for remote code execution and infrastructure misuse. STRIKE also shared steps organizations can take to reduce exposure.
February 10, 2026
Recent Data Breach Examples
Discover how real data breach examples expose third-party risks. Learn from MOVEit, healthcare breaches, and M365 attacks to protect your business.