TITAN AI Reporting Agent
To understand your first- and third-party risk, you have to report on it whether that’s the number of security issues at a particular company, or a portfolio of vendors’ score changes over time. Reporting and historical benchmarking are essential.
Today, that often means pulling data, exporting it, and building the charts yourself a lot of manual time and effort. That’s where the reporting agent in the TITAN AI platform comes in.
Where to Find It
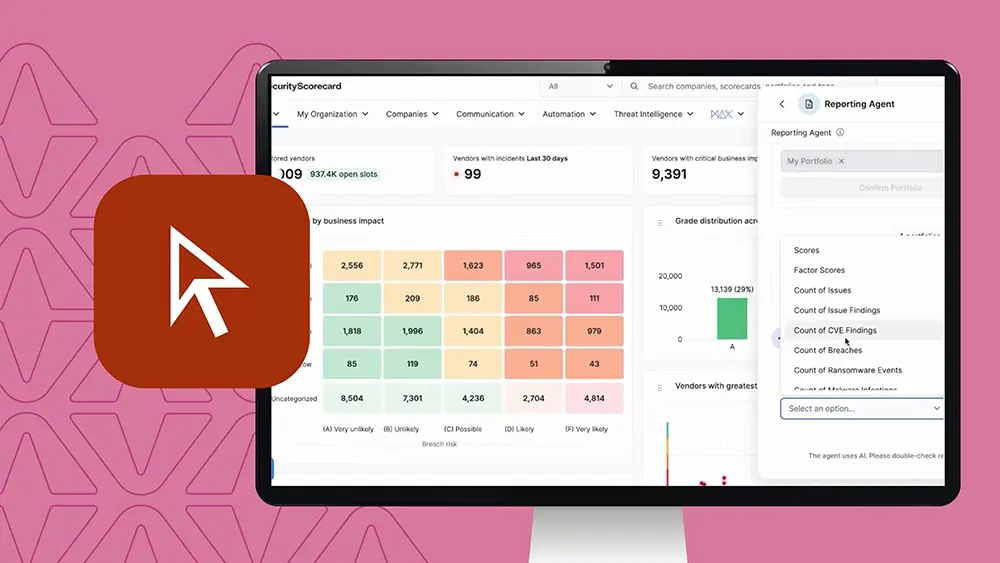
Access the agent with the purple sparkle icon in the bottom right corner of your screen. From there, you’ll see ten different AI agents, all built to save you time. The reporting agent lives under Analysis and Monitoring.
How It Works
Step 1: Choose what to analyze. The agent asks a few questions to figure out what type of graph or chart you want to build. For example, select a portfolio of vendors you’re monitoring.
Step 2: Pick your metric. Choose what you’d like to analyze score changes, issue findings, CVEs, breaches, or whatever’s appropriate.
Step 3: Choose your format. Select the format you’d like the chart in.
Step 4: Set your time period. Choose how you’d like the data broken out for example, weekly and the range you want to analyze, such as the past 90 days to cover a full quarter.
The Result
The agent automatically generates the report, showing average score changes on a weekly basis over the selected time period. You can:
- Download the report as a CSV
- Download the graph itself to drop into any presentation
You can always run the agent again for a different chart style or type.
Get Started
This is one of ten AI agents built to save you time and reduce manual effort, so you can focus on higher-leverage work.